Istanbul puts the money where AKP voters are
Mayor of Istanbul suggested that he would invest more in the districts where AKP voters live. I analysed his investment plan for 2018, and found strong evidence that he means it: the districts governed by AKP receive on average around 250 million ₺ more from the city. Statistical tests point to a partisan motivation behind this difference in public investment.
Last week, Mayor Mevlut Uysal suggested that his administration prioritises serving the voters of Erdogan’s party (AKP), stating that the new metro lines will go to the districts where their voters live.
Uysal’s statement is highly controversial—even for the supporters of his own party—and many argue that this is not an AKP policy. As a political scientist, I am curious to see what the statistics say.
This is why I have analysed the investment plan of the AKP’s Istanbul Metropolitan Municipality (IMM) for 2018, and found evidence that Mayor Uysal was probably right: Istanbul’s money seems to go where AKP voters are. In addition—as another signal that the public funds are used strategically for party political purposes—his administration invests more in the districts that AKP marginally won in 2014.
The plan lists 555 projects, with information on how much money will be invested in which districts. Some projects cover more than one district, and I calculated their share by simply dividing the total investment equally between them. I have ignored projects that lists the whole city, or the whole European or Asian sides as the target area, to cut the noise out.
Let’s have a look at how the investment is distributed among the 39 district municipalities in Istanbul, 25 of which governed by AKP and the remaining 14 by the main opposition, Republican People’s Party (CHP).
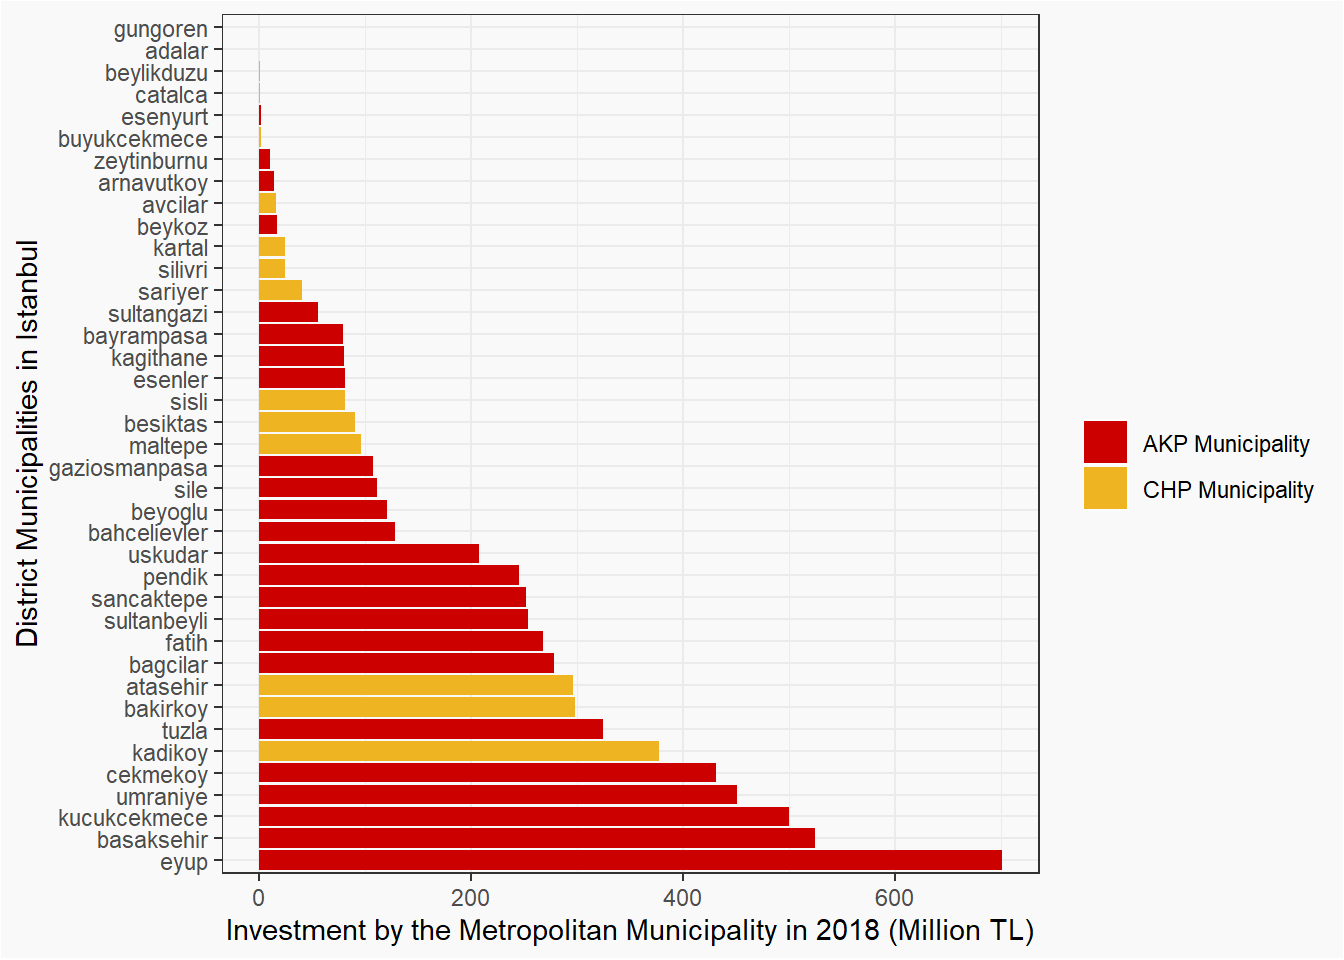
There are big differences among the district municipalities with regard to how much IMM invests in their territory. We should note that, while CHP has 36% of the districts, none of the top 5 most-invested districts are governed by the opposition party. In fact, we see only 4 CHP districts within the top 20.
Here I am interested in understanding whether how people vote explains these differences, and—if so—how much of the difference it accounts for.
There is probably very many reasons behind these differences, and not all would be party political. Once could think of economic reasons, for example, and if poorer districts tend to vote for AKP and the IMM tends to invest more in these poorer districts, then it would be misleading to suggest that the IMM prioritises to serve the voters of Erdogan’s party.
One way around the unobserved factors is to find a variable that would be a necessary and sufficient condition for party political decisions, but one that has nothing to distinguish the districts in any other way.
Winning vote margin is one such variable, often used in similar studies in political science. Here if we take the AKP margin of victory as a threshold, those districts immediately above have an AKP municipality and those immediately below have a CHP one. This allows us to go a step closer to detect if there are cause and effect relationships.
Let me explain with an example. In 2014, AKP won the Kucukcekmece district with a 2.3% cushion while it lost Kartal with a similar margin, 2.1% of the valid votes cast. We can assume that these two districts are similar in many ways, except that the former has an AKP administration while CHP governs the latter. If there is indeed only one difference between such districts on each side of the threshold, the differences that we see in their investment must be due to that difference. Let’s add this factor to our analysis.
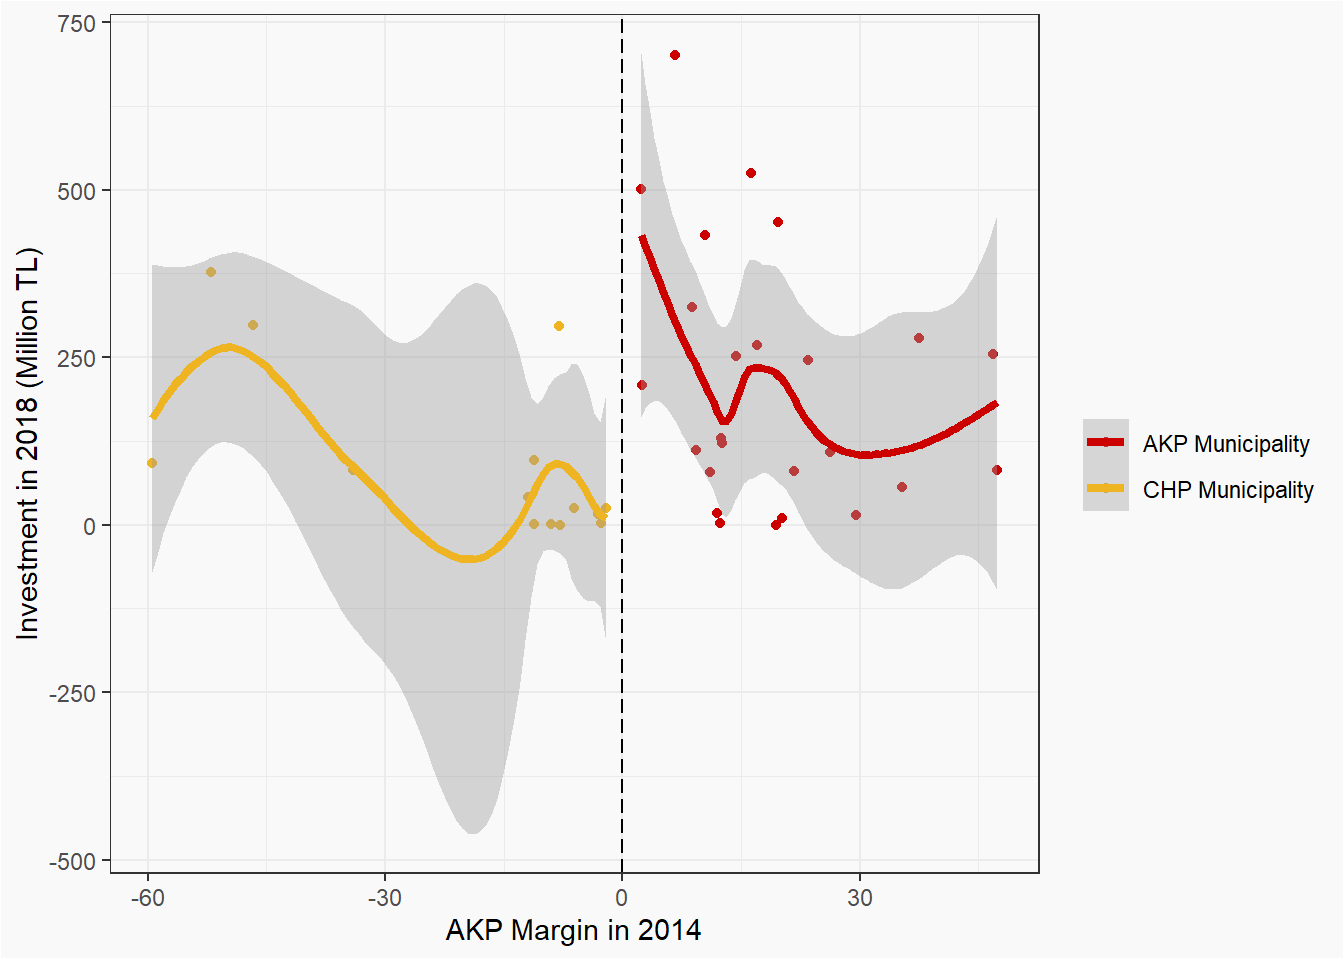
There is a clear difference between the districts that AKP the AKP lost and won with small margins, and we would normally not expect to see this unless IMM treats AKP and CHP districts differently.
I will use two statistical tests to investigate these differences further.
First, we can see if there is a significant correlation between these electoral results and the investment in a linear regression. The table below report results from two models, with and without covariates. Specifically, the second model controls for the size of the districts, in terms of both the number of voters and the geographical area that they cover.
| Dependent variable: | ||
| Investment | ||
| (1) | (2) | |
| AKP Municipality | 270.001** (84.421) | 247.092** (85.503) |
| AKP Majority | -4.126* (1.714) | -4.242* (1.715) |
| Electorate | 0.0003 (0.0002) | |
| Area | 0.021 (0.117) | |
| Constant | 18.368 (53.946) | -63.077 (85.196) |
| Observations | 39 | 39 |
| R2 | 0.221 | 0.279 |
| Adjusted R2 | 0.178 | 0.194 |
| Residual Std. Error | 161.103 (df = 36) | 159.569 (df = 34) |
| F Statistic | 5.119* (df = 2; 36) | 3.283* (df = 4; 34) |
| Note: | This table reports ordinary least square regression models, with standard errors in brackets. * p<0.05, ** p<0.01, *** p<0.001. | |
With or without the additional controls, the results are substantively the same: on average, AKP municipalities are predicted to receive about 250 million TL more than the CHP municipalities.
Besides, there is a negative relationship between AKP winning margin and the amount of investment: it seems that larger the AKP’s winning margin in a district, the less Mevlut Uygur is planning to invest there. This would indeed be strategically more meaningful if a party invest more in the districts that are marginal than very safe—something that we can see in Figure 2 above.
Both these results are statistically significant—that is, the possibility that these differences happen by chance is small enough by the standards of social sciences.
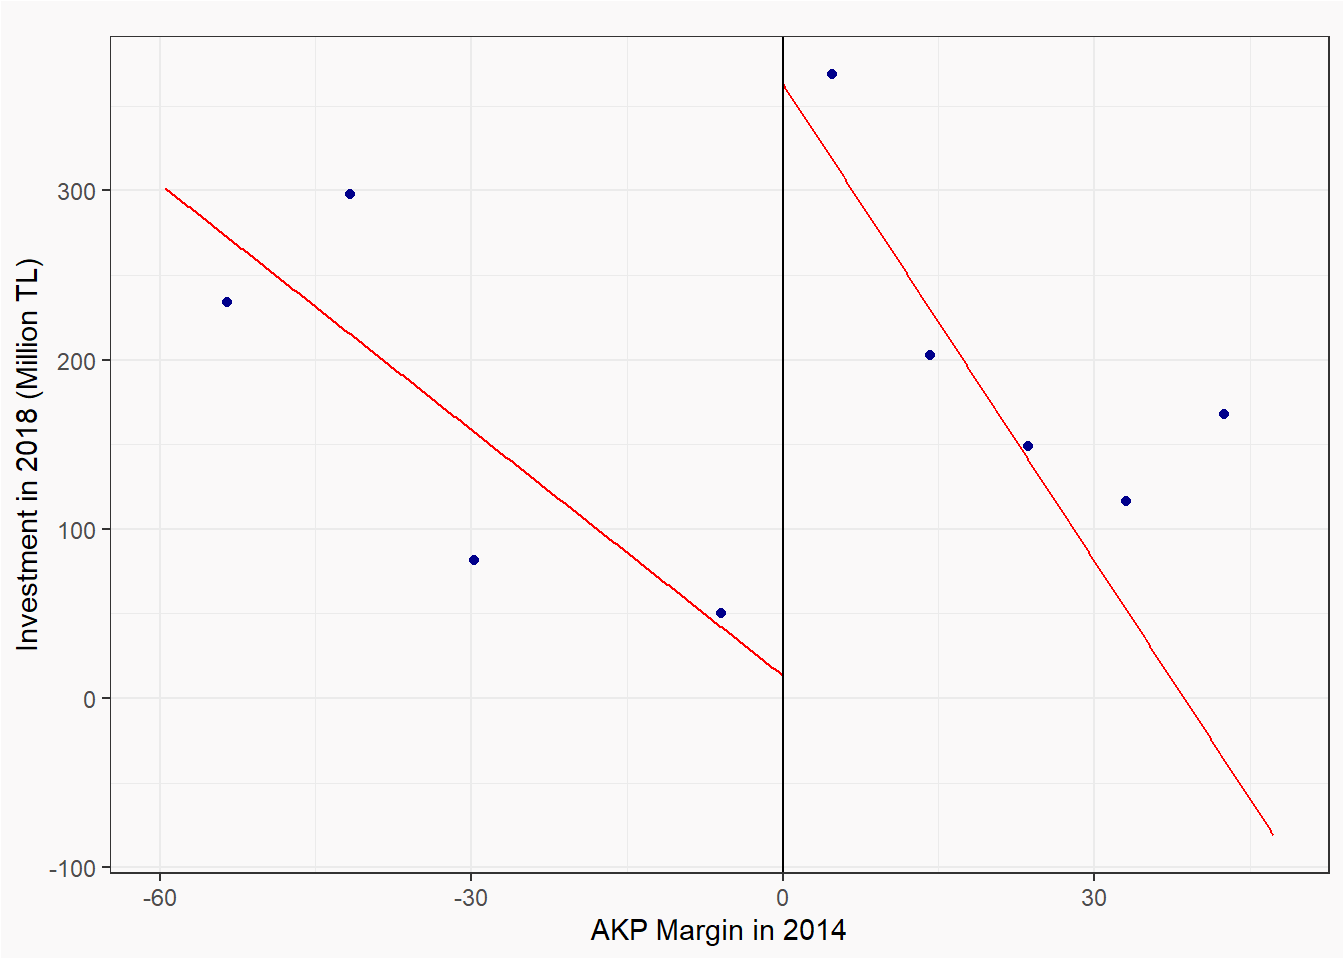
To increase our confidence in these results, we can repeat our analysis in the regression discontinuity models. These models focus on the difference between the threshold in Figure 2, making use of the margin variable. These models confirm the main result above, that there is a significant difference in terms of money invested AKP vs CHP districts.
If we plot the regression discontinuity estimates, we see this difference in a clear picture.
To sum it all up, there are significant differences between the mount of public money invested in the districts of Istanbul. It is clear that AKP districts are better off as they receive on average around 250 million TL more from the city.
The tests I offer above provide strong evidence that these differences are due to party politics. At the very least, such differences are something we would not expect to see among these districts that are similar in many respects—except that some has AKP municipality and the others do not.
What is at stake is not just the new metro lines; it is all over the whole investment plan.